# Before It Breaks: How AWS Keep You in the Loop
Imagine you’re running a mission-critical web app on AWS — smooth traffic, happy users, no issues in sight. Then suddenly… *bam!* your site slows down, latency spikes, or your database gets grumpy.\
But before you even notice, AWS already knows something’s off.
That’s where **AWS alerts** come in — your early warning system when things go sideways.
Let’s break it down in simple terms: what AWS uses to alert you, how it does it, and most importantly, how you can *actually make sense* of those alerts.
### The Why — Why AWS Alerts Even Matter
Cloud environments are like massive cities — thousands of moving parts, each one vital. EC2 instances, databases, load balancers, APIs, network routes, and more.\
When something breaks, it can be like one traffic light going out and causing a city-wide jam.
AWS alerts are there to:
* Catch problems early (before your users do)
* Tell you *what’s breaking and where*
* Help you fix things faster
So instead of hunting blindly through logs, AWS does the detective work for you.
### The Who — Meet Your Alerting Tools
Here’s how AWS keeps watch over your environment:
#### Amazon CloudWatch
This is your main “eye in the sky.”\
CloudWatch monitors *everything*: CPU usage, memory, request rates, disk space, errors — even custom metrics.
**Example:**
> *If your EC2 instance CPU usage goes above 85% for 5 minutes, CloudWatch can send you an alert (called an* alarm*).*
**You can set:**
* **Thresholds:** e.g., “Alert me if CPU > 85%”
* **Period:** e.g., “for at least 5 minutes”
* **Actions:** e.g., “Send an email or trigger an auto-scaling policy”
#### AWS Health Dashboard
Think of this as AWS’s personal “status update” system.\
If AWS itself (not your app) faces an issue — like an outage in a region or a maintenance event — you’ll see it here.
**Example:**
> *“AWS is performing maintenance on RDS in your region at 2:00 AM UTC.”*
You’ll get notifications in your **Personal Health Dashboard** or via **Health Events** integrated into your monitoring setup.
#### AWS CloudTrail
This isn’t an alerting tool *by default*, but it’s how you *trace what caused* an issue.\
CloudTrail records every API call — who did what, when, and from where.
**Example:**
> *“Someone accidentally terminated an instance.”*\
> \&#xNAN;*CloudTrail tells you exactly who and how.*
Combine CloudTrail with CloudWatch Logs, and you can create alerts for suspicious or critical actions (like IAM policy changes or security group modifications).
#### AWS Trusted Advisor
This one’s like a friendly consultant that checks your setup and tells you what’s wrong — from cost inefficiencies to security risks.
**Example Alerts:**
* “S3 bucket is publicly accessible”
* “EC2 instance is underutilized”
* “No MFA on root account”
It’s less “real-time alerting” and more “preventative health check.”
#### AWS SNS (Simple Notification Service)
This is how AWS actually **tells** you something’s wrong.\
CloudWatch → SNS → *you get the message* (via email, SMS, Lambda, Slack, etc.)
You can think of SNS as the **messenger** — it doesn’t detect issues, but it delivers the alerts.
### The How — What an AWS Alert Looks Like
Let’s say you’ve set a CloudWatch alarm. When it triggers, you might get something like this in your email:
```
ALARM: "HighCPUAlarm"
State change: OK → ALARM
Description: "EC2 Instance CPU > 85% for 5 minutes"
Timestamp: 2025-11-13T11:22:45Z
Account: 123456789012
Region: us-east-1
Instance ID: i-0ab12cd34ef56gh78
```
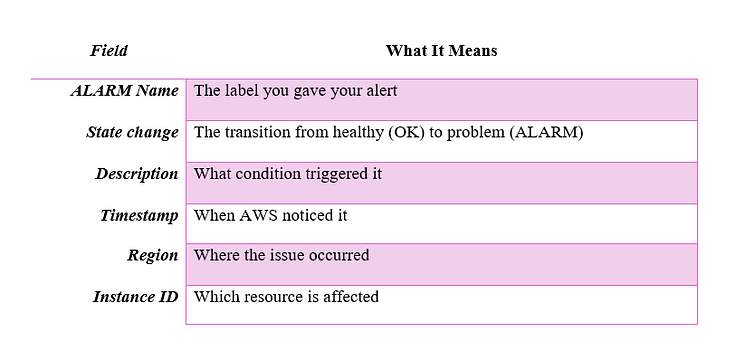
At first glance, it looks robotic. But here’s how to **decode it:**
Press enter or click to view image in full size
Once you know this pattern, every AWS alert starts making sense.
### The Smart Way to Handle Alerts
Here’s where most teams mess up — they *get* alerts but don’t *use* them effectively.\
Here’s how to actually make them useful:
#### **Group alerts by priority**
* *Critical:* Application down, DB unreachable
* *Warning:* High CPU, latency spikes
* *Info:* Scheduled maintenance, config changes
#### **Add context in every alert**
* Which environment? (prod/dev)
* Who owns it? (team or service)
* How to fix it? (link to runbook or doc)
#### **Avoid alert fatigue**
* Don’t alert on *every little spike*.
* Use sustained thresholds (like “for 5 minutes”) to reduce noise.
#### **Integrate with Slack or PagerDuty**
* Email gets ignored.
* Slack or on-call tools make sure the right person sees it *instantly.*
### Learn to Read Between the Alerts
An alert is just the *symptom*, not the *disease*.
For example:
* “High CPU” could mean inefficient code, memory leaks, or load spikes.
* “RDS connection timeouts” could mean network throttling or instance limits.
* “S3 bucket public” could mean a misconfigured IAM policy.
Don’t stop at the alert. Dive into **CloudWatch Metrics**, **Logs Insights**, and **X-Ray traces** to find *why* it happened.
### Bonus: Automate Your First Response
This is where things get fun. You can make AWS *fix issues automatically* before you even wake up.
Example setup:
* CloudWatch alarm detects CPU > 90%
* SNS triggers a **Lambda function**
* Lambda adds one more EC2 instance or restarts the failing one
Boom — **self-healing cloud**.
### Wrapping It Up
AWS gives you all the tools to know when things go wrong — but understanding the *story behind the alert* is where you truly level up.
Here’s the formula:
> ***CloudWatch** detects → **SNS** alerts → **You (or Lambda)** respond → **CloudTrail/Logs** explain → **Trusted Advisor** prevents it next time.*
When you master this flow, your AWS setup doesn’t just *react* — it *adapts.*